ODDS
Try this: flip a coin until you land tails.
Do another trial, keep flipping until you get a tails.
The average number of trials it’d take to get “this many” heads in a row, below:
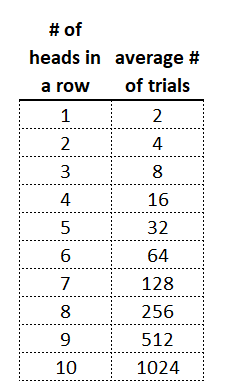
That means, on average, you’d have to run the trial of trying to get 10 heads in a row 1024 times before you’d win.
DYING
People die. Kind of a lot of people die. In the US (2018), there were 2.8 million deaths in a population of 327 million, that’s a little less than 1% of the population. Using our probability framework above, in one year you had about a 1 in 117 chance of dying, about the same as running coin-flipping trial and getting heads ~7 times in a row. Rare, but not quite rare enough, right?
Of course that is not quite complete, there are other variables to consider, take age for example.
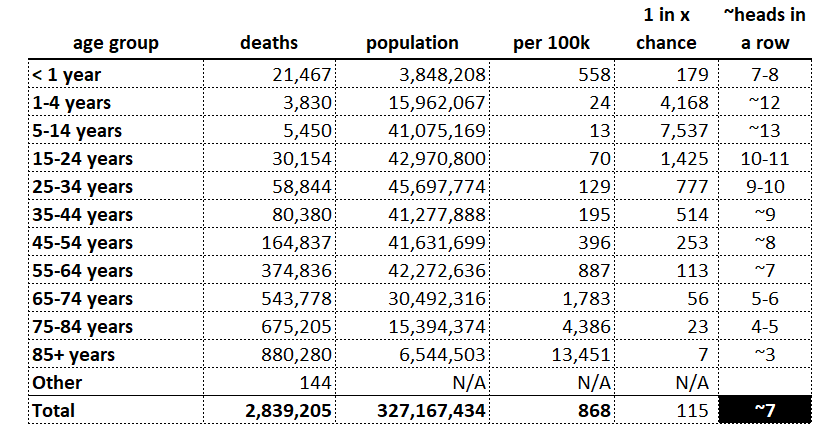
(Note 1: 2.7 million divided by 327 million gives you this funky decimal .08678 so you multiply it by 100,000 so the decimal moves over 5 places and it is hecka-easier to read and translates to 868 deaths per 100,000 people)
(Note 2: less math-based than note 1, but also observe that 144 people died in an “other” age category, these are probably aliens tracked w/o age by the government.[2])
Even then you are just scratching the surface of variables: what about:
- Where you live
- Your specific health conditions
- Your genetic profile
- How much time you spend doing high risk stuff
These are all important, but I’m trying to get to this, how in the world do you make a decision about what to do with COVID-19?
MAKING A DECISION ABOUT COVID-19
Since we are now used to this funky deaths per 100,000 measurement.
AND we know how many people have died so far ~200,000 as of end of Sept. https://covidtracking.com/data/national/outcomes
AND we know how many are projected to die within a range (High: 335,000 and Low: 275,000. https://covid19.healthdata.org/united-states-of-america?view=total-deaths&tab=trend
We can start some clean up:
• Make it monthly
• Annualize stuff
• Make it age ranged, dang, no good age buckets, make it under/over 65
• Argh, conflicting details, use KFF call it 80% of deaths are over 65.
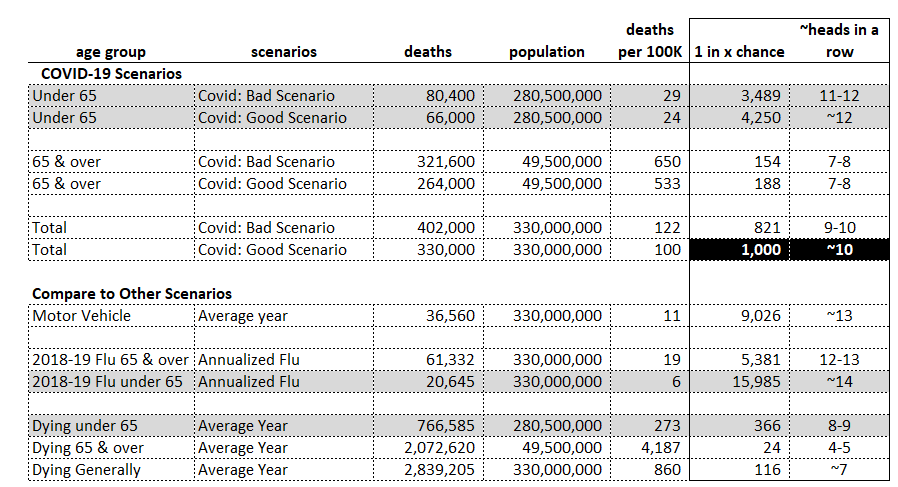
• Build table, voila
SO WHAT?
Using some back-of-the-napkin-but-not-so-complex-but-actually-useful-math that for some reason is impossible to find anywhere on the internet those are your rough odds.
If you are under 65:
(& no individual variables like geography hot spots, comorbidities, etc.) you are 3x more likely to die from coronavirus than from driving a car in an average year, but both events are as rare as flipping a coin 11+ times and getting heads every time.
BUT it is additive meaning you still have the risks associated with driving & the flu.
AND it is an unknown disease so we don’t know if there are some surprising consequences from having it.
PLUS who wants to be sick or pass along a much more dangerous disease to folks who are over 65.
If you are over 65:
it is worse than the flu by a significant amount. Know your odds & take necessary precautions.
In a real way, COVID tests our communities & country because it exposes us to life & death consequences and genuine confusion about what is true (including potential lies at worst & unknowns at best). We have enough data that we know taking precautions whatever our age & situation is a small price to pay and can be a compassion-driven, rational response. It is a practical chance to put some meaning behind the word United in the United States of America.
NERDY STUFF
For those who could and therefore should do this better, please create a more sophisticated input without more complicated output, i.e. what are the odds. Many favor data but when no one understands how to apply it to themselves it is impossible to use.
Sources:
- [2] aliens: this was just a joke, thanks for noticing.
- projections: https://covid19.healthdata.org/united-states-of-america?view=total-deaths&tab=trend
- annualizing:
- % 65 & under: https://www.wolframalpha.com/input/?i=projected+%+over+age+65+united+states
- motor vehicle deaths: https://www.iihs.org/topics/fatality-statistics/detail/state-by-state#:~:text=There were 33%2C654 fatal motor,Columbia to 22.2 in Mississippi.
- 2018-19 flu: https://www.cdc.gov/flu/about/burden/2018-2019.html
- 2018-19 flu note: this is not tracked as well as you’d hope, read into the details if interested, I annualized it for comparison purposes.
- rough estimate general death rate 65 over and under: http://www.disastercenter.com/cdc/Death rates 2005.html
- % over 65 COVID-19 deaths: https://www.kff.org/coronavirus-covid-19
- all cause mortality: https://wonder.cdc.gov/ (nice online tool)

